Polling Paradoxes
The Wibbly-Wobbly, Timey-Wimey World of Election Uncertainty
😮💨
Playing
You have a 90% change of winning…
Uncertainty
Lost ❌
✅ Won
Uncertainty
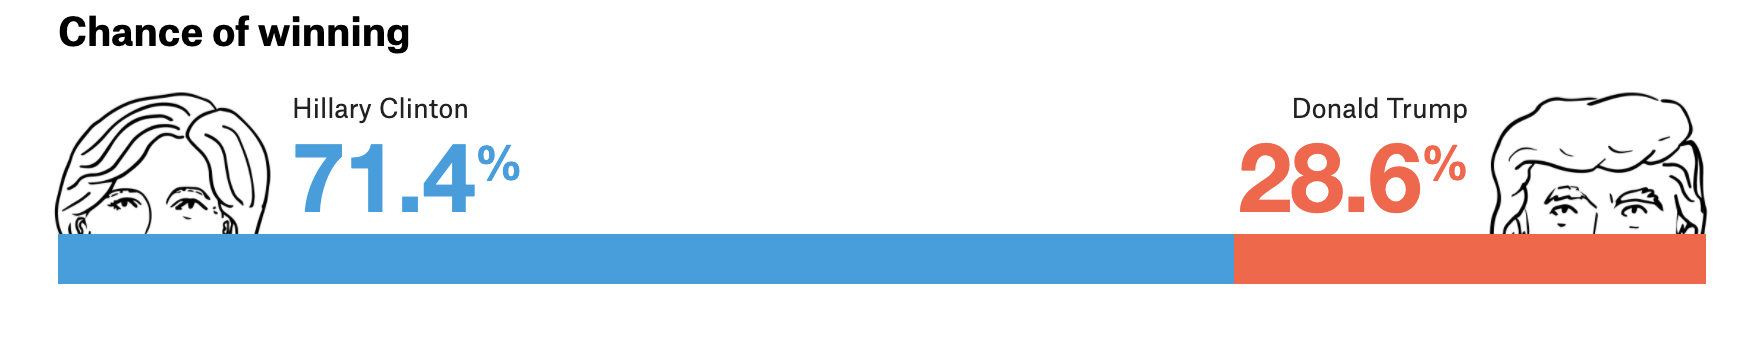
How can we understand this result?
Lost ❌
✅ Won
Probability vs. Certainty: A 71.4% chance for Clinton meant she was favored, but not guaranteed to win.
Why have polls become so bad?..
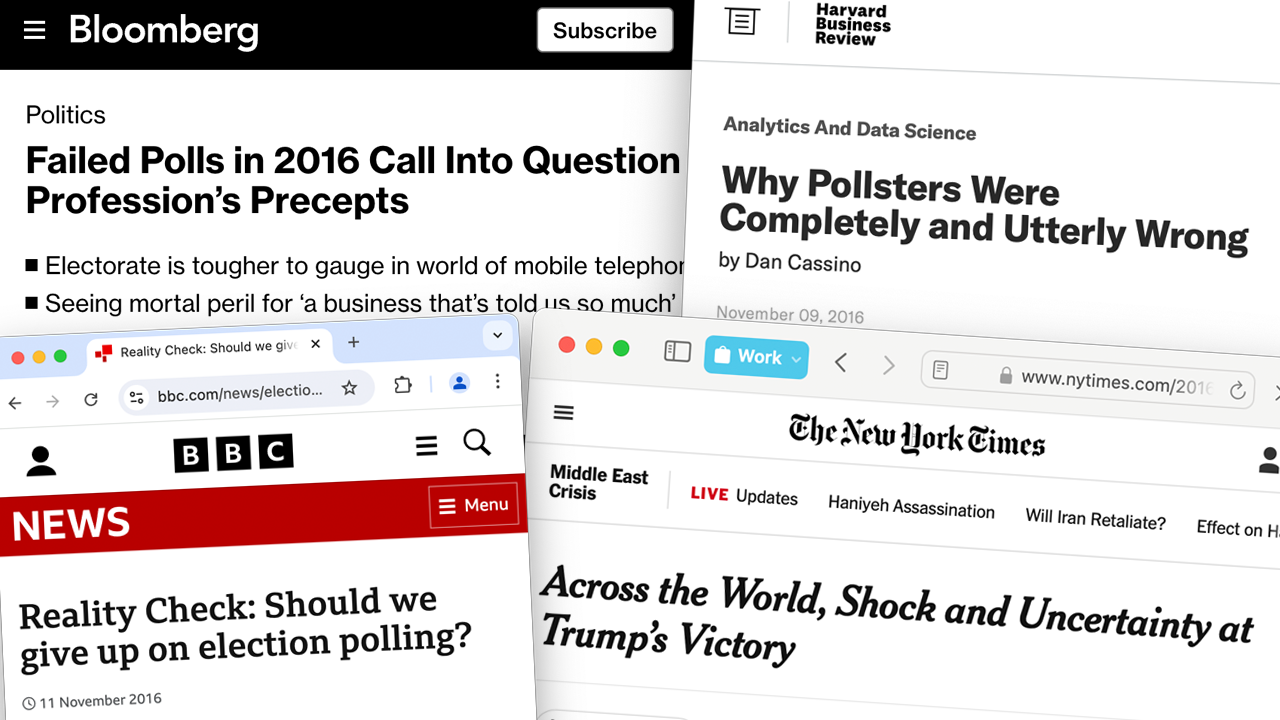
Well, its not actually that bad…
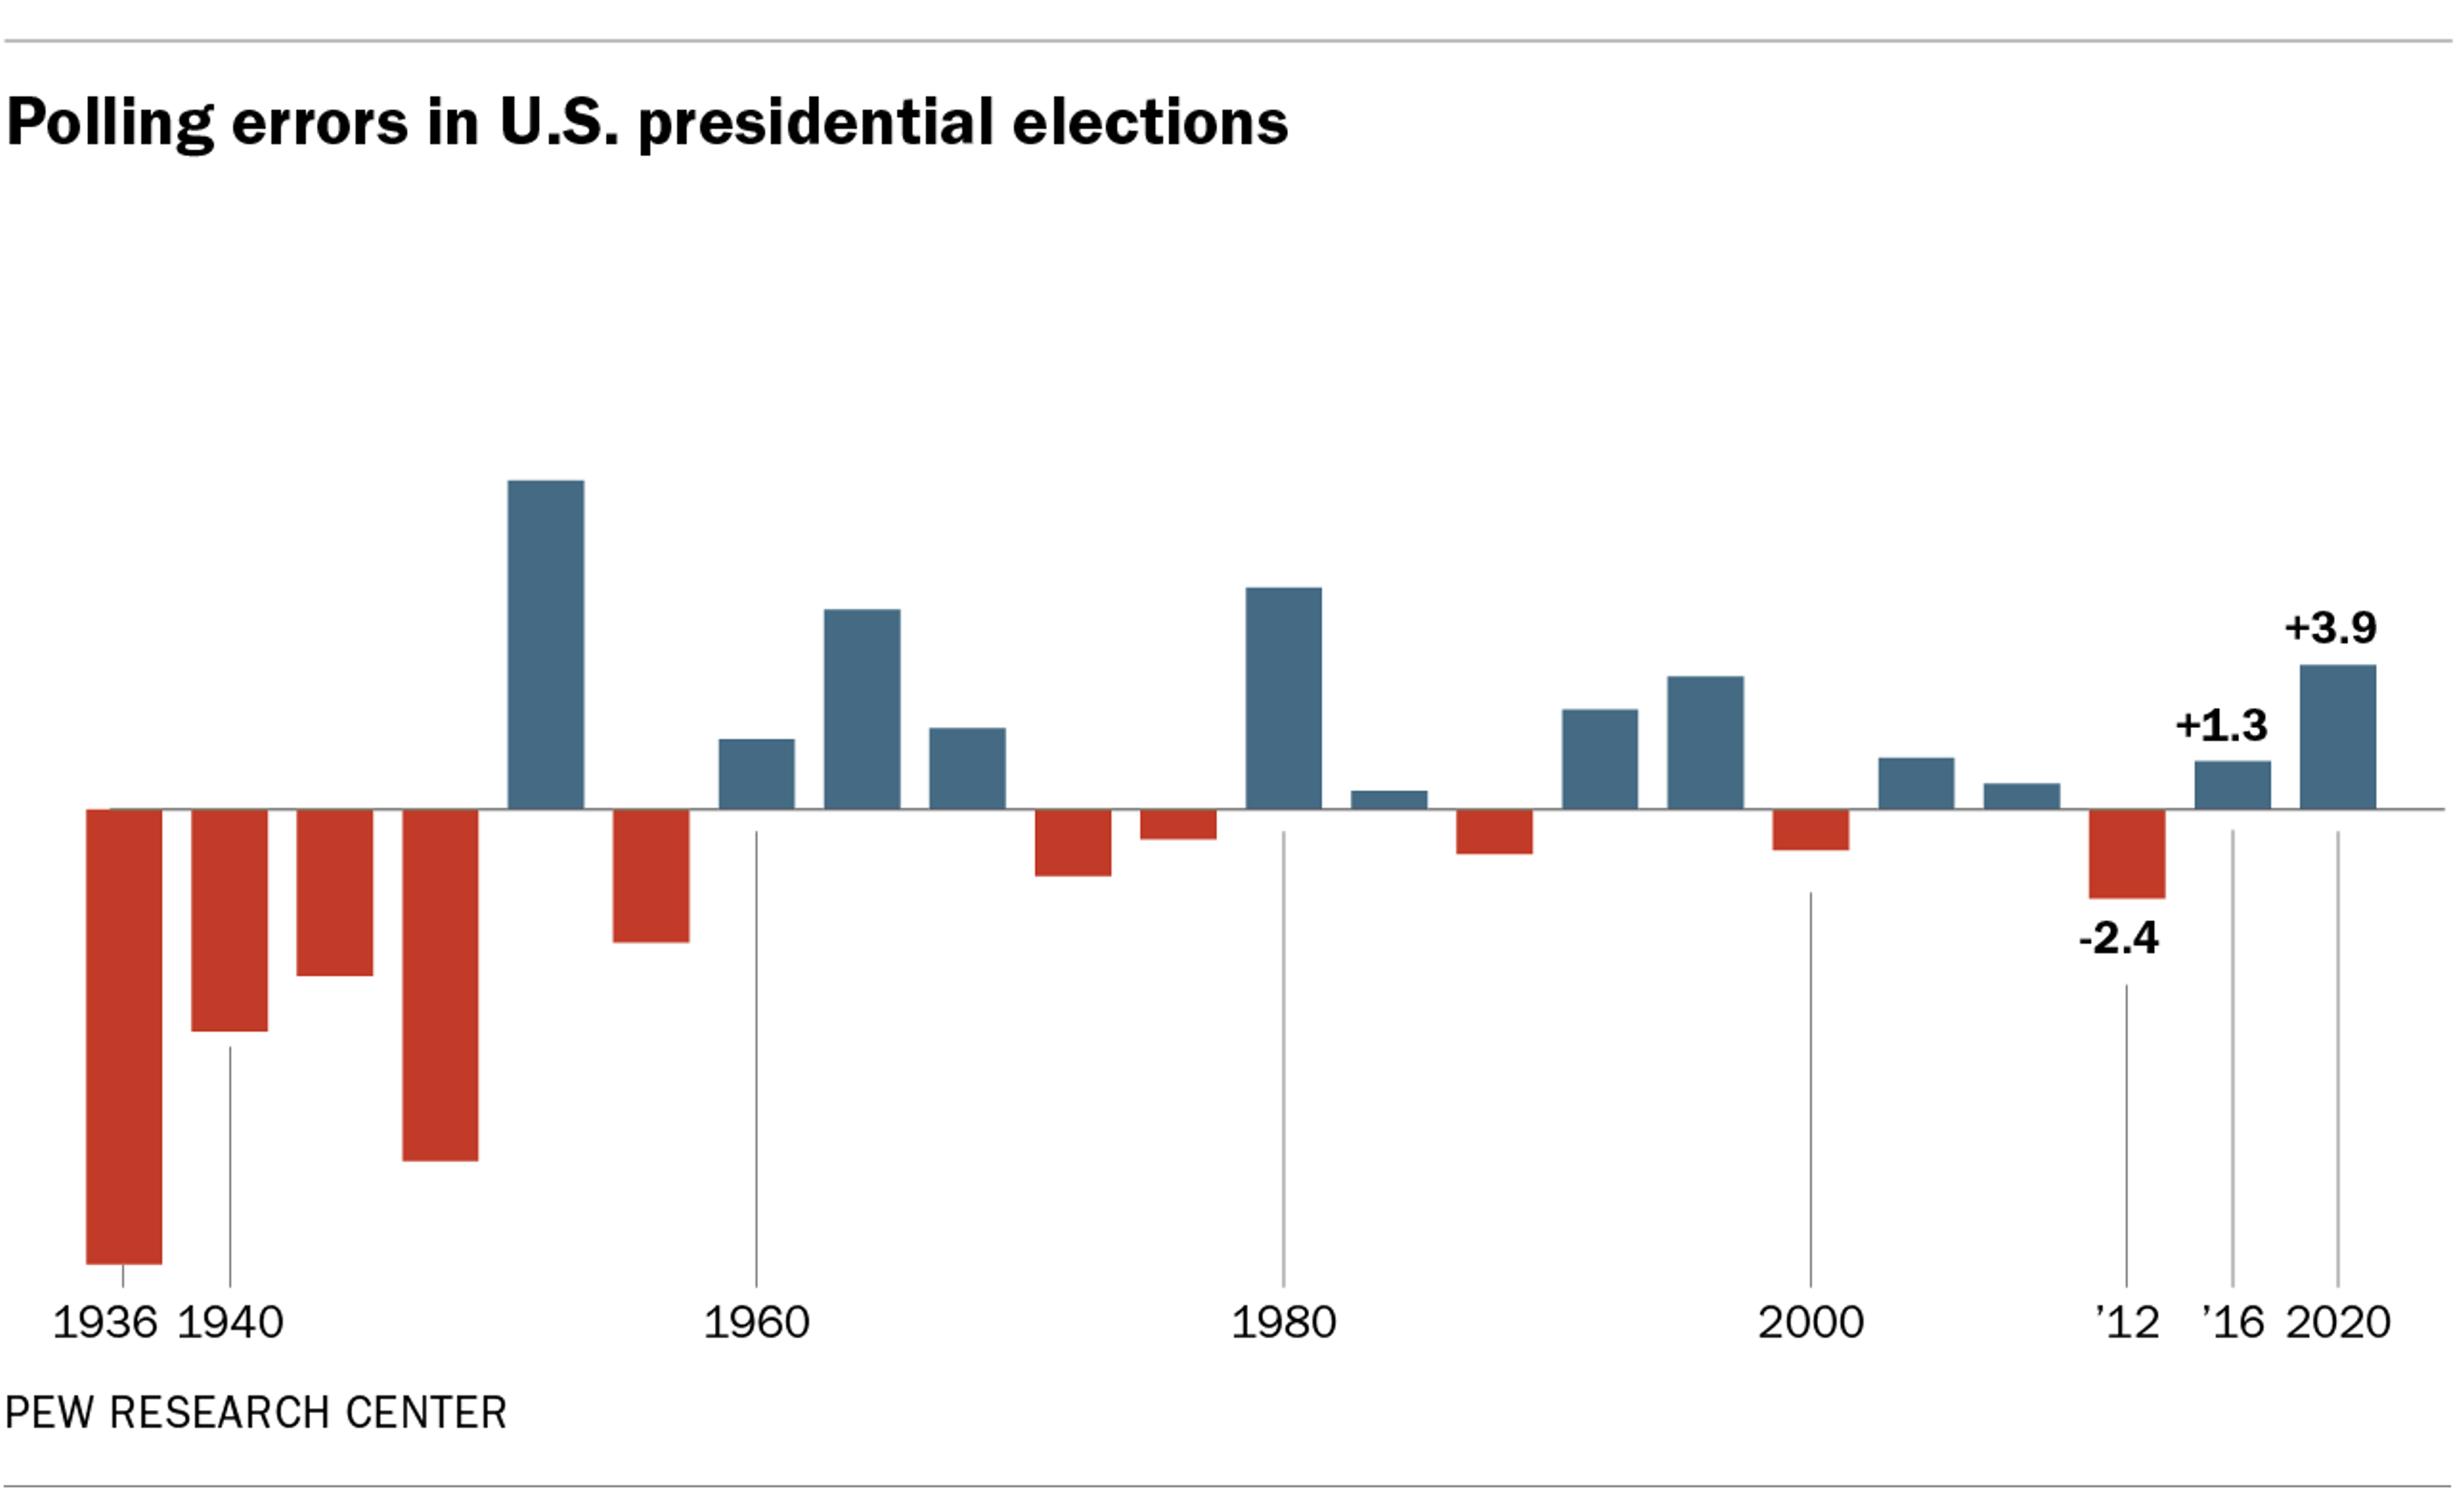
Well, its not actually that bad…
Well, its not actually that bad…
Polling has change a lot
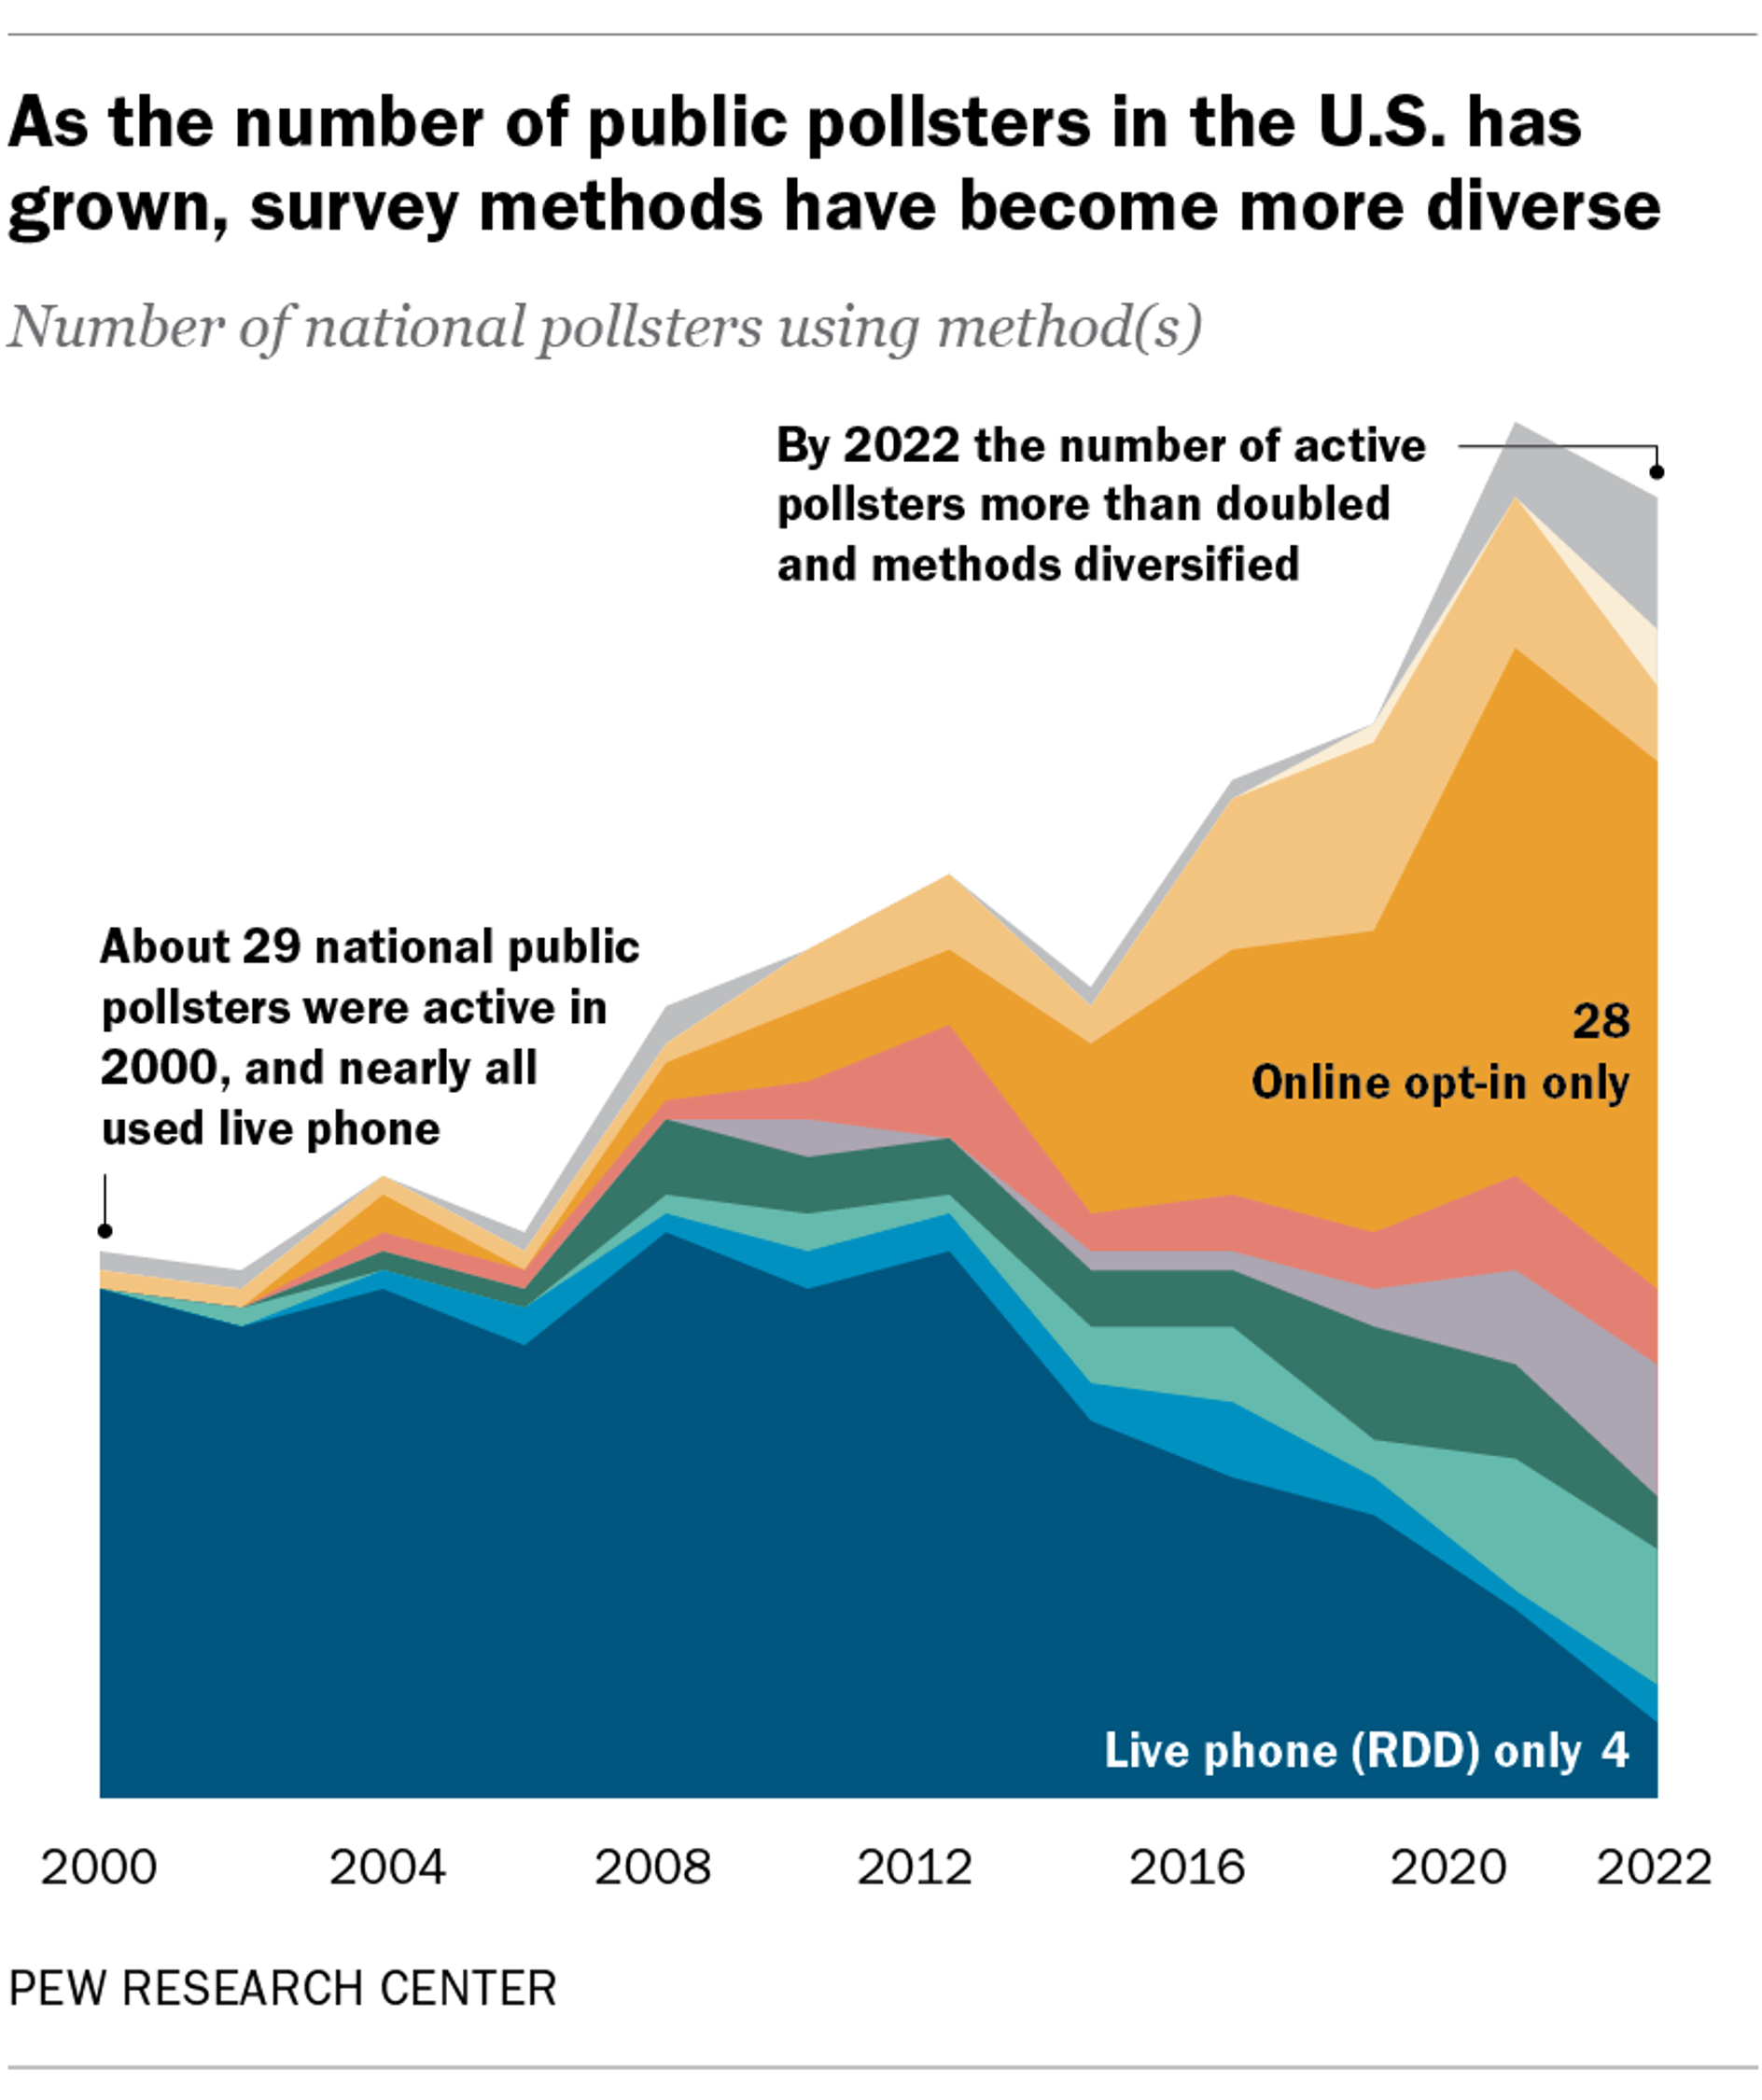
Polling has change alot
Public opinion polls. Survey the opinions of respondents on any number of topics.
Baseline/benchmark polls. Baselines levels of voters’ perceptions, knowledge, opinions.
Brushfire polls. Voter sentiment during a race: “favorable” and “unfavorable”.
Tracking polls. Shorter, smaller daily polls that track how perceptions, attitudes, and opinions change.
Exit polls. Exiting polling locations on Election Day, to learn how they voted.
Push polls. Worded to lead the respondent toward a certain response.
Straw polls. Unofficial ad hoc vote.
😵💫
The dangers of favorability: Outcome
So favorability comes from polls?
So favorability comes from polls?
Not always… 😮💨
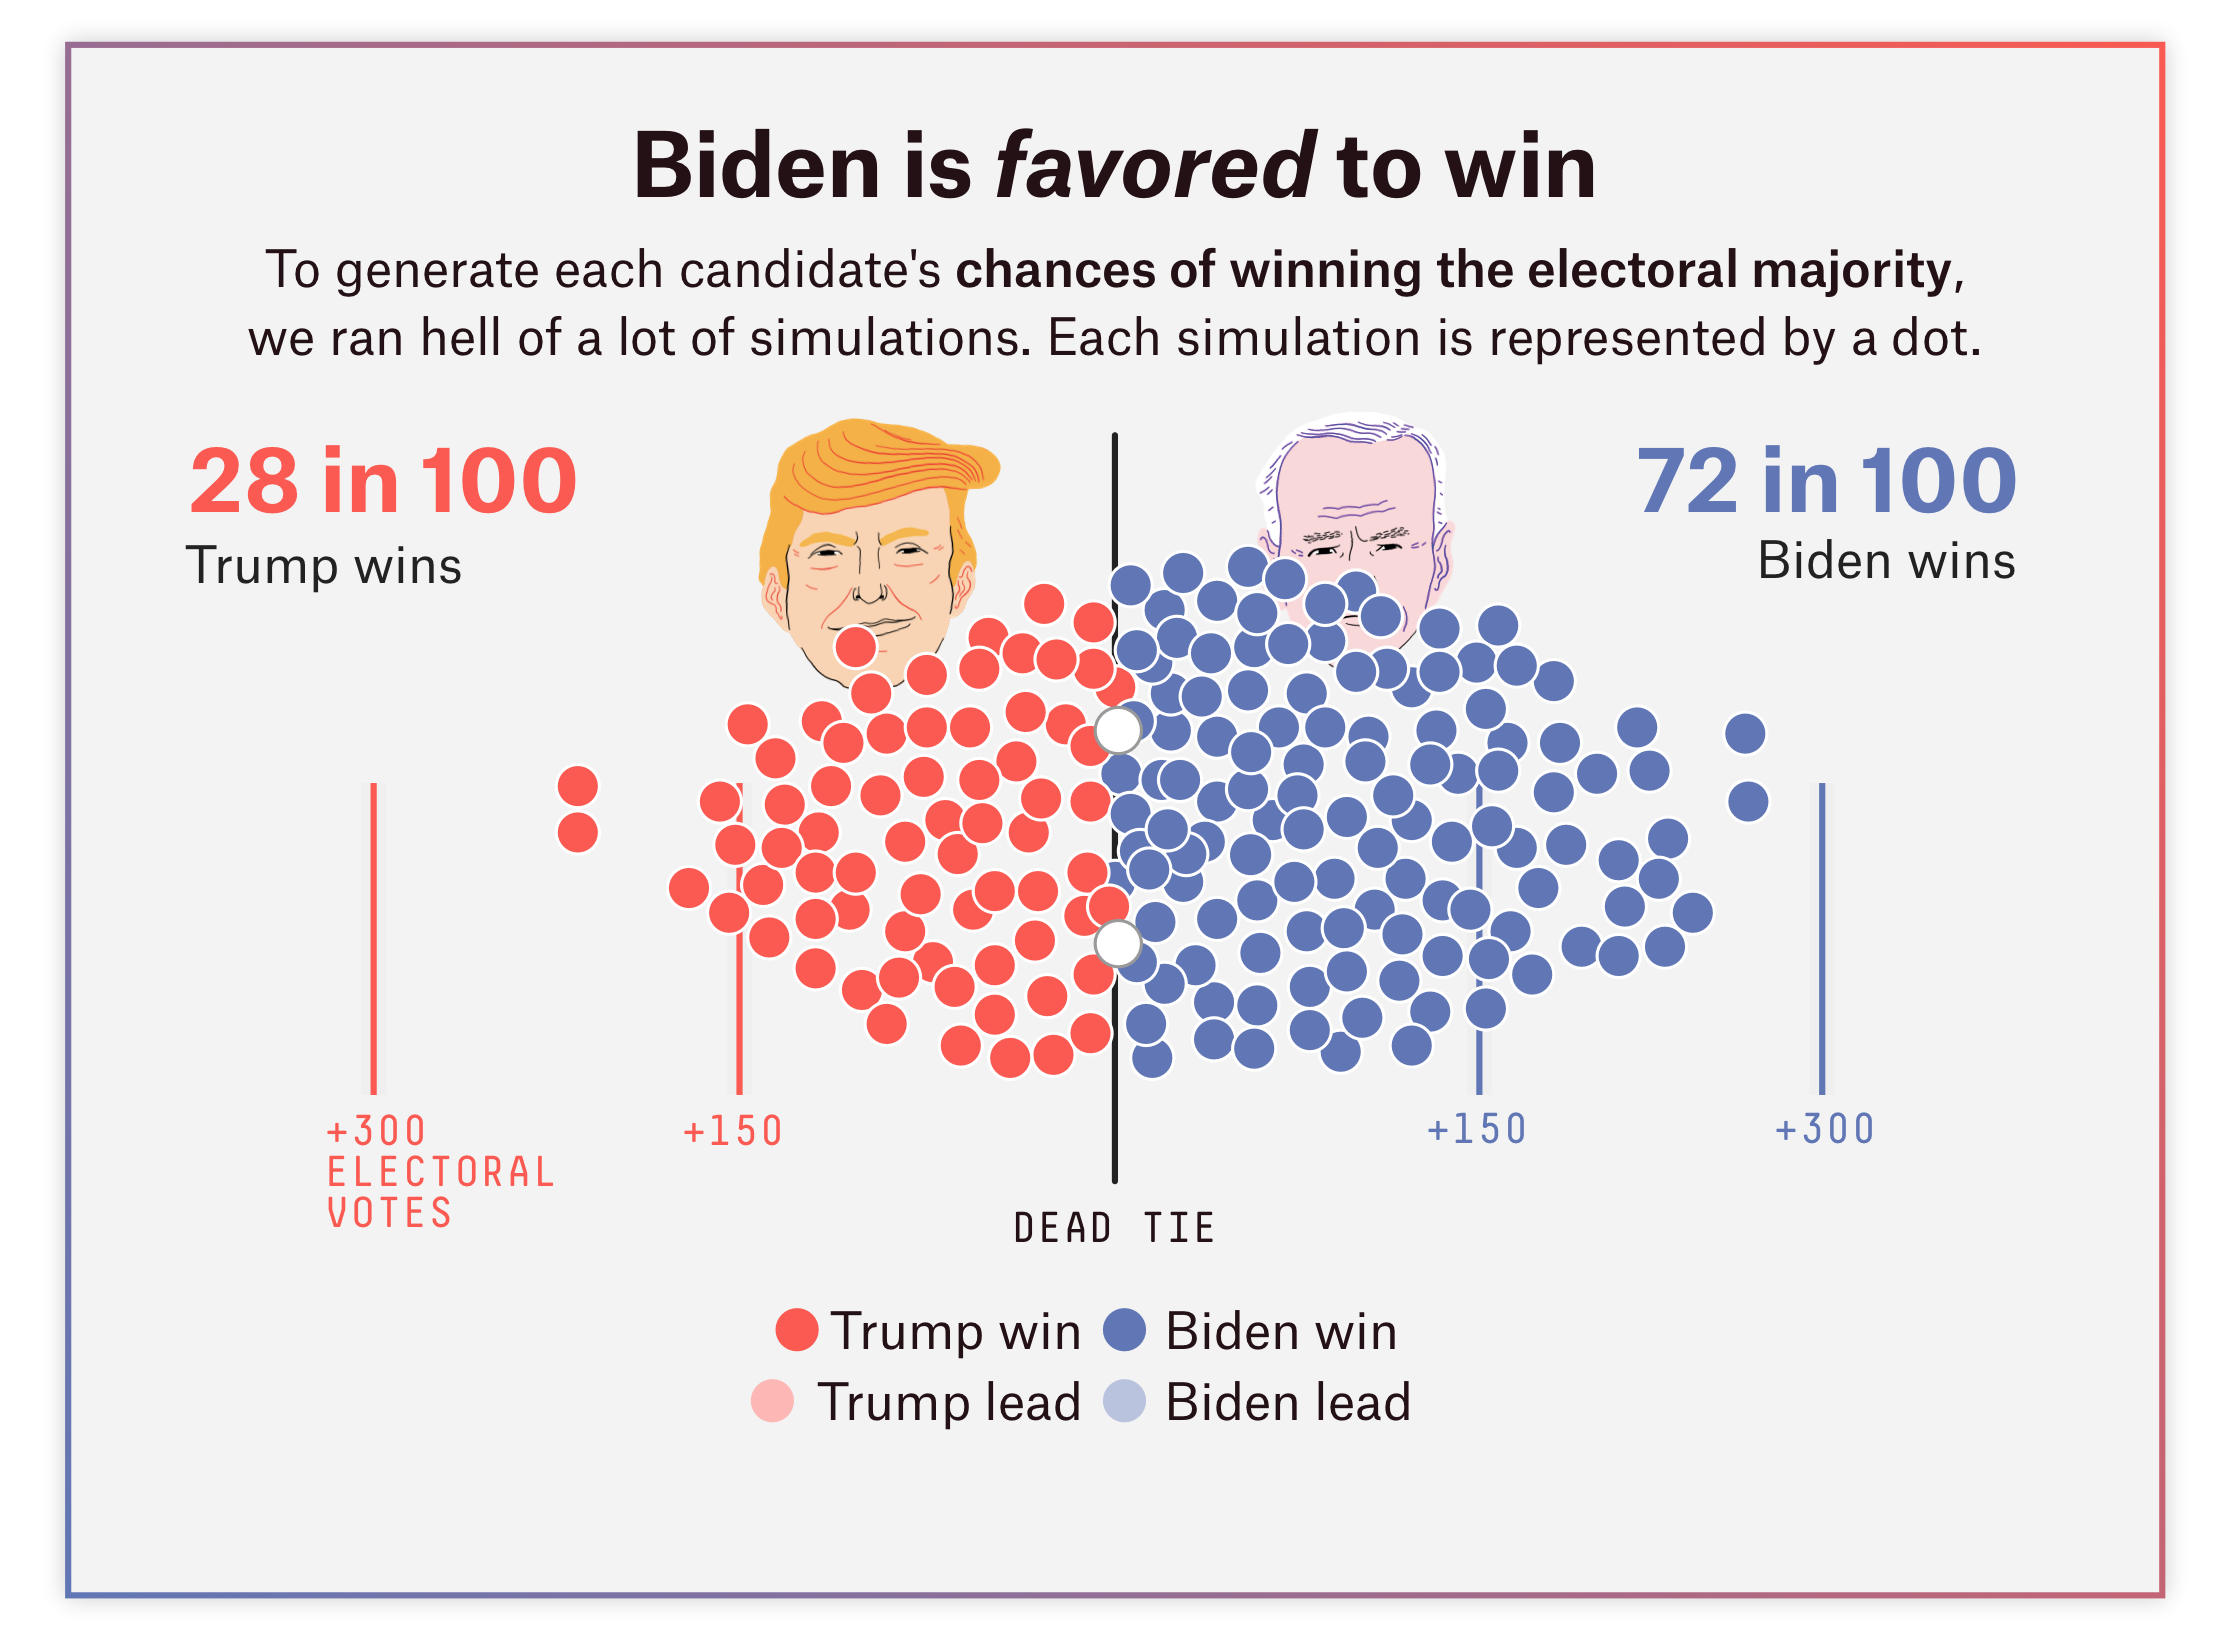
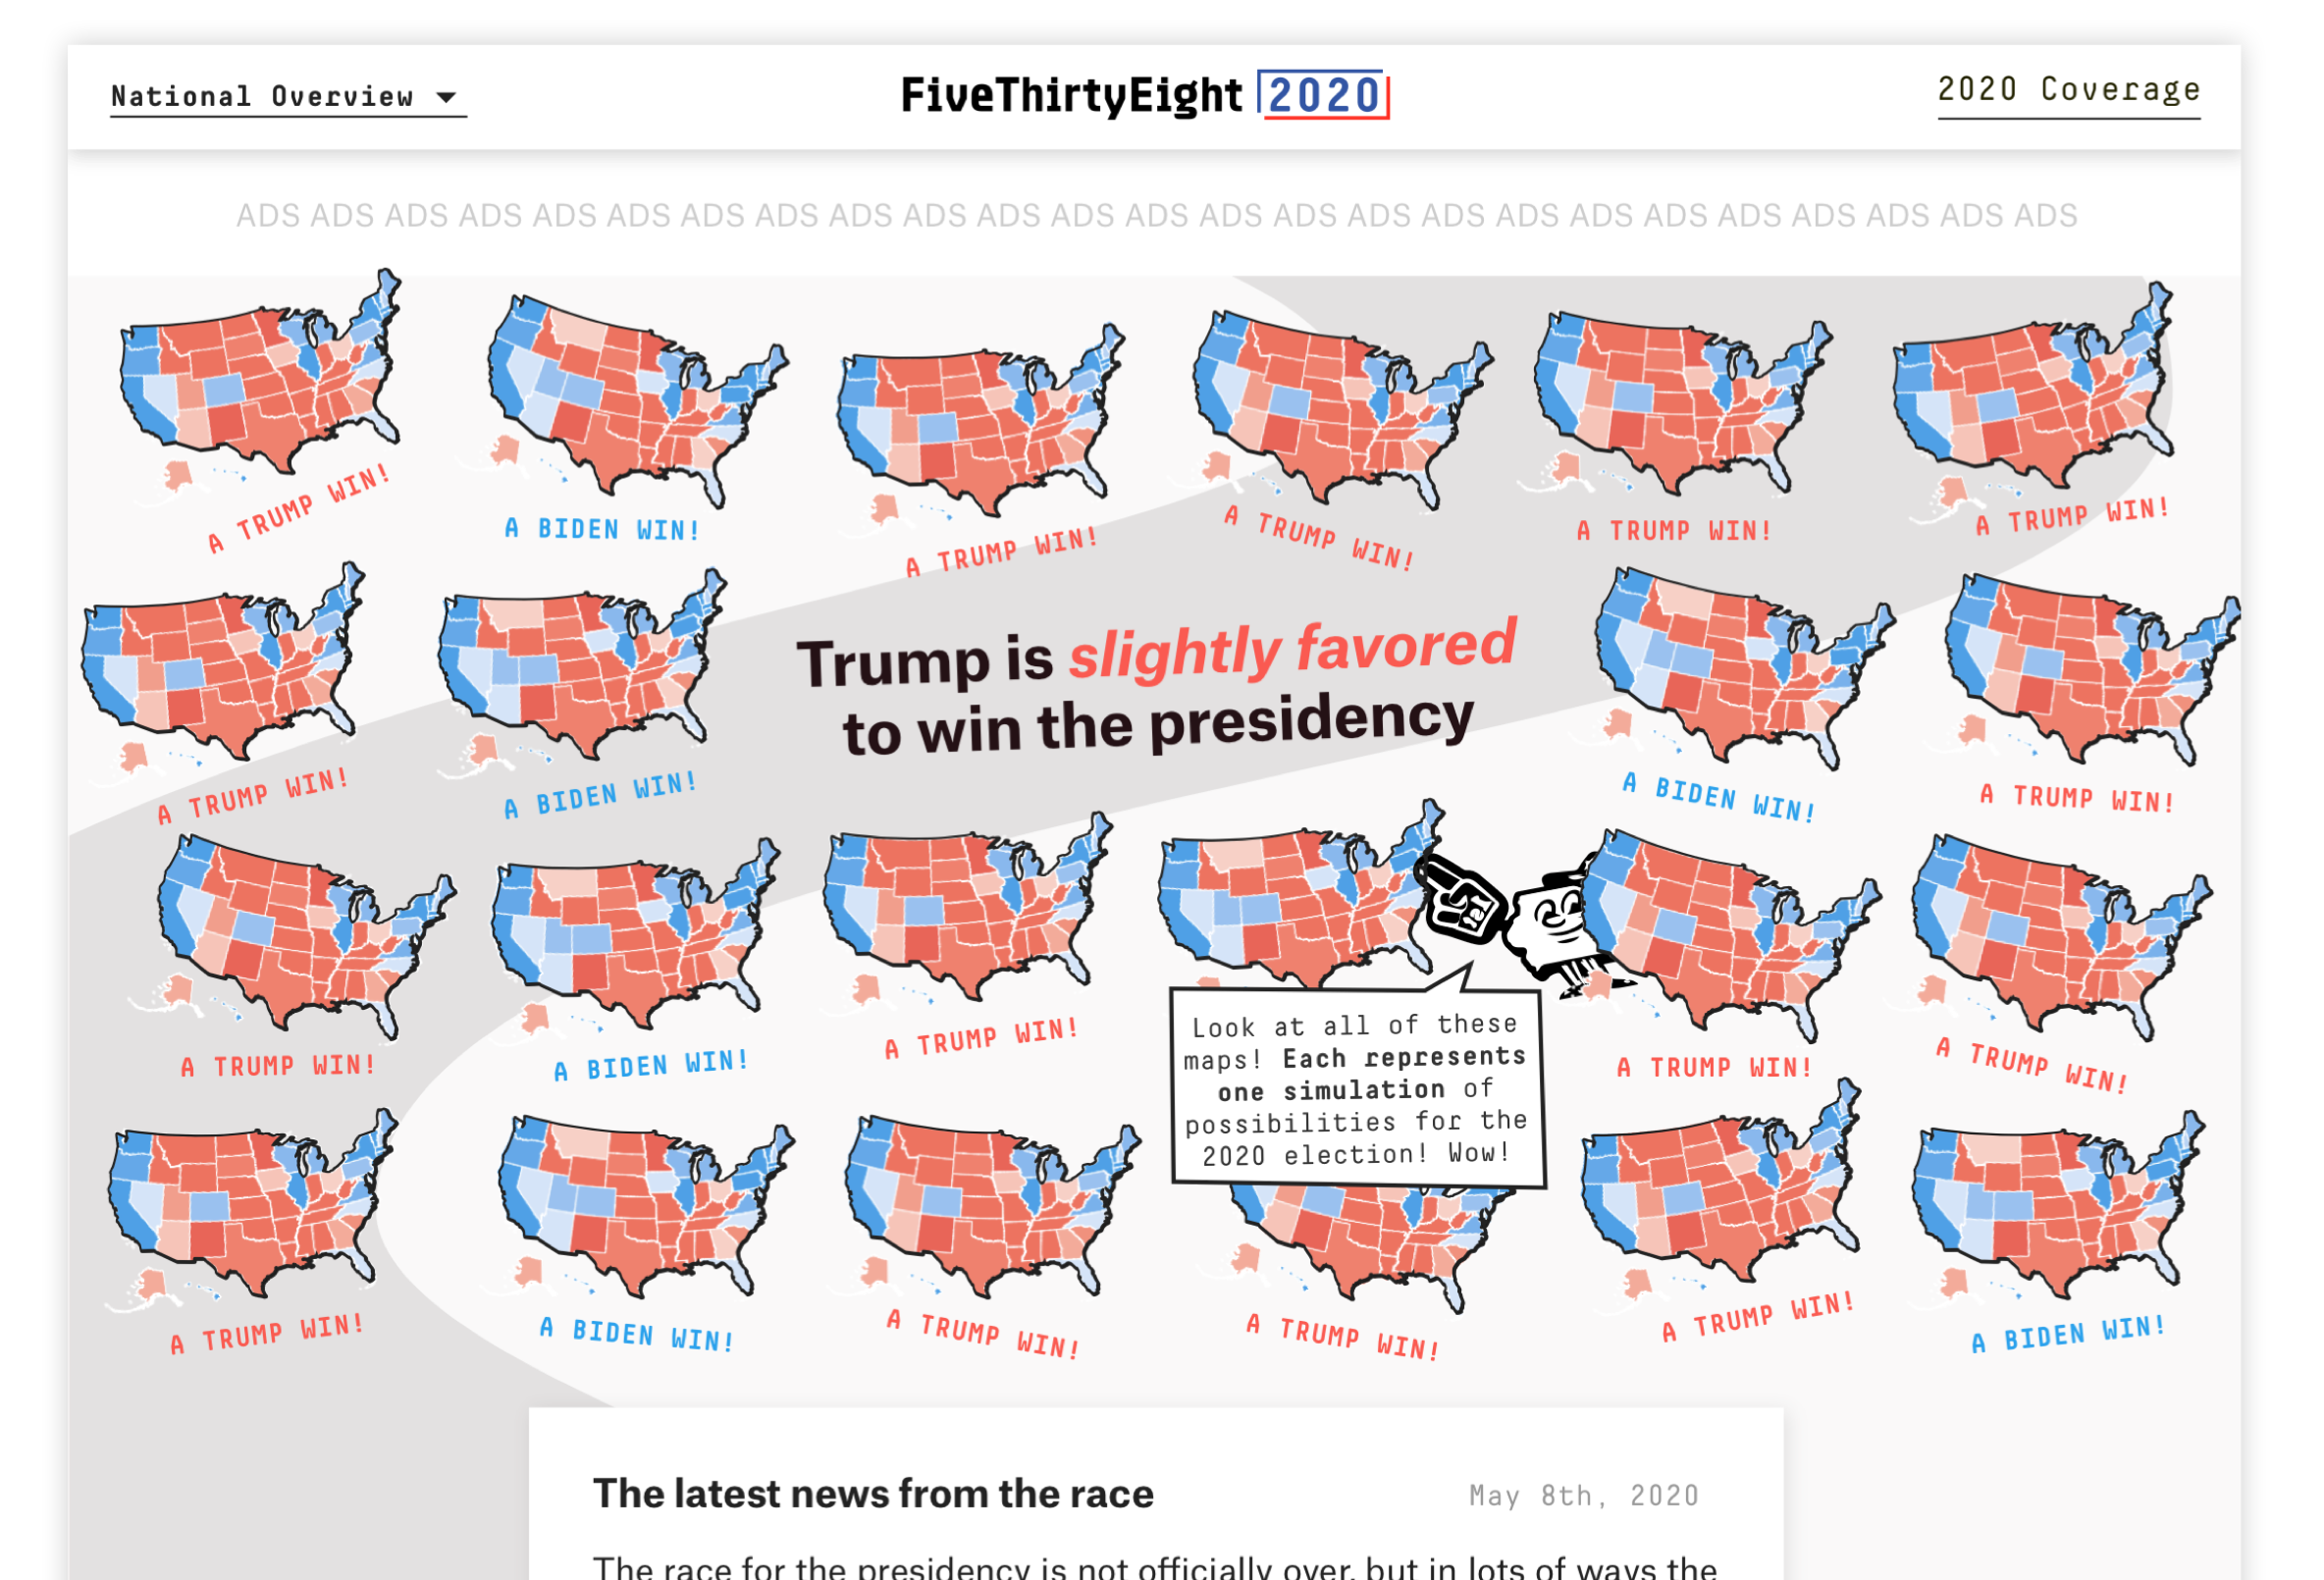
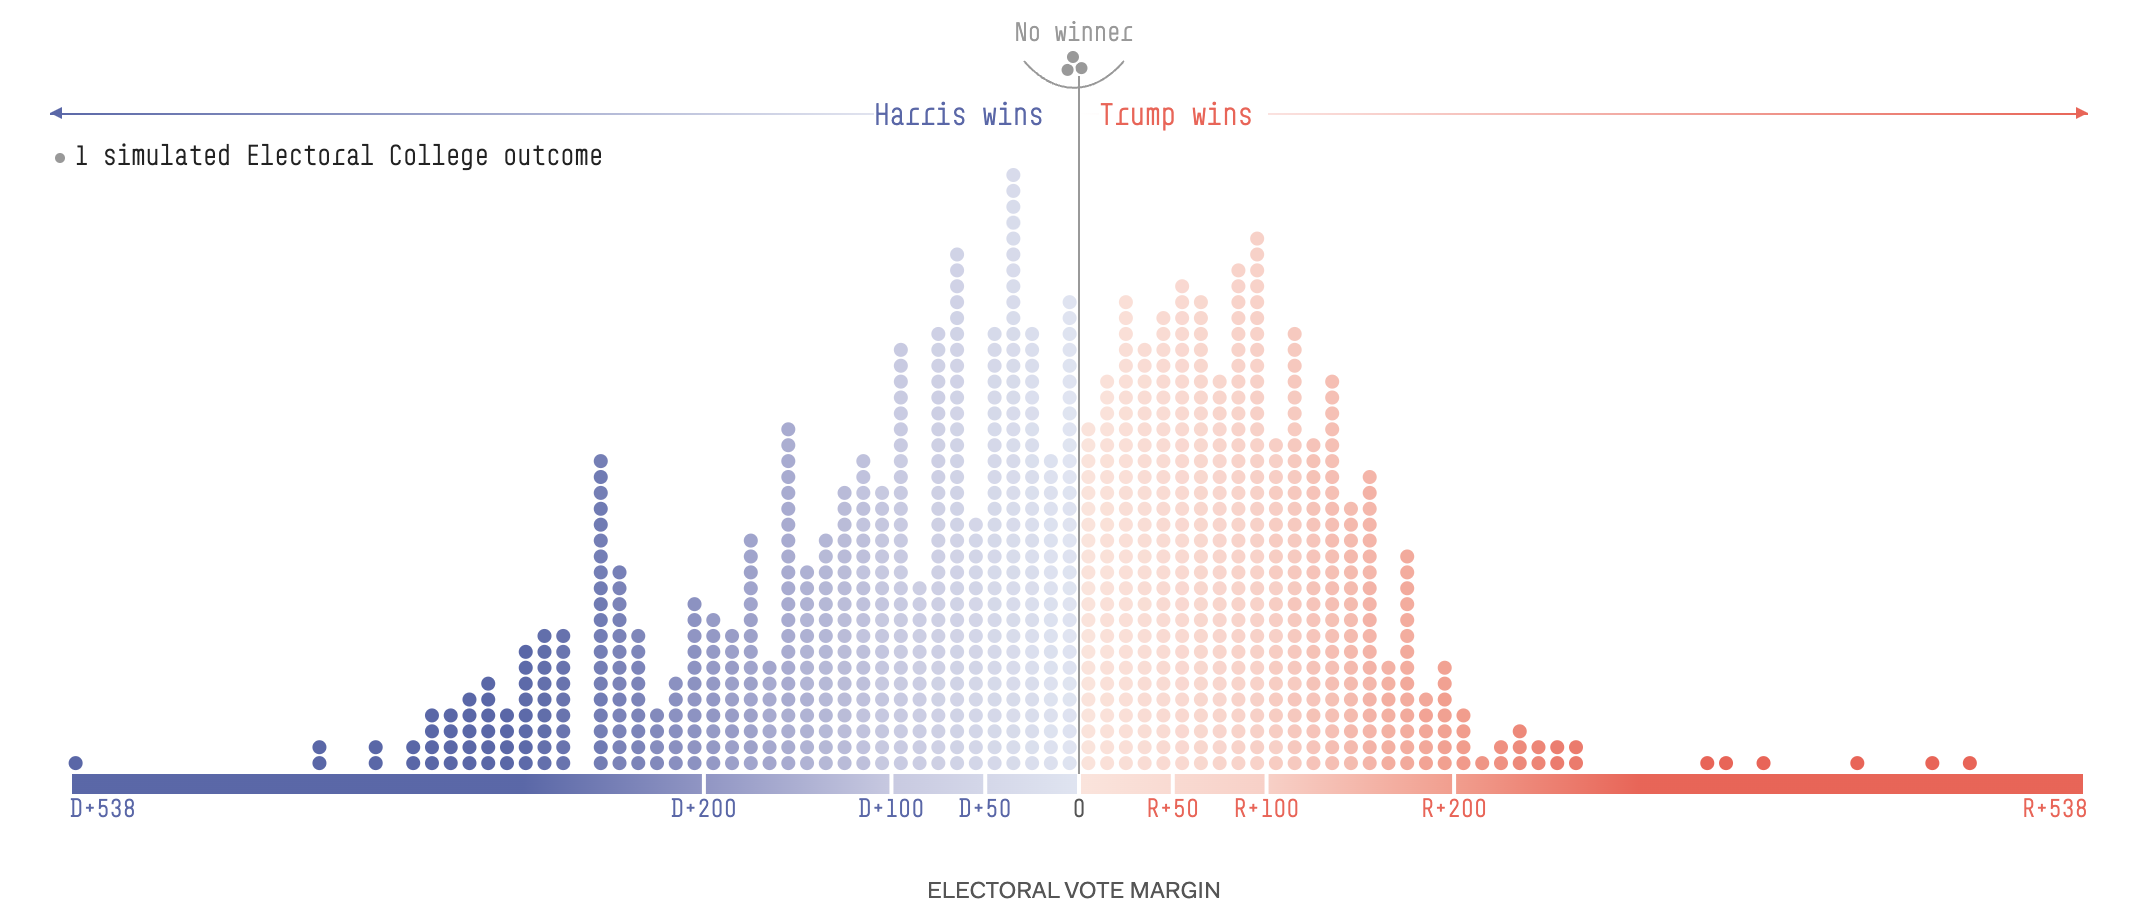
Simulations
Purpose: present a range of possibilities
Pros: give a sense of build-up and possibilities
Cons: data overload can lead to interpretation difficulty
The dangers of favorability: Maps
Obscurity/Blurriness
Purpose: Fogginess is a powerful visual metaphor
Pros: Intuitive metaphor
Cons: Subject to different interpretation; hard to show levels of uncertainty
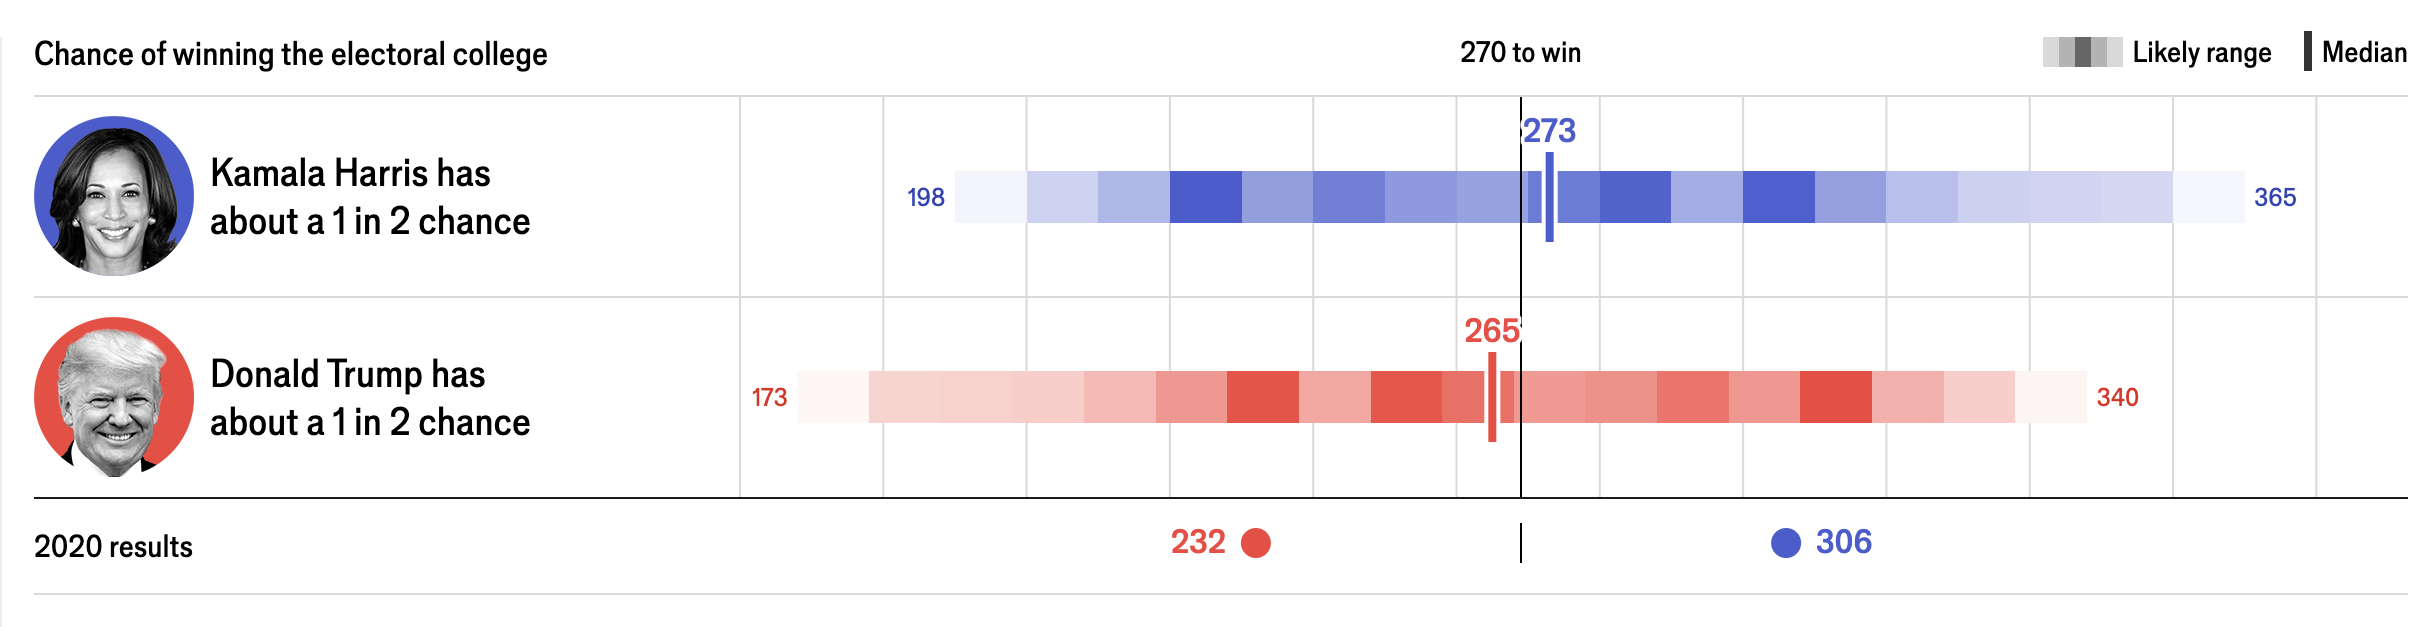
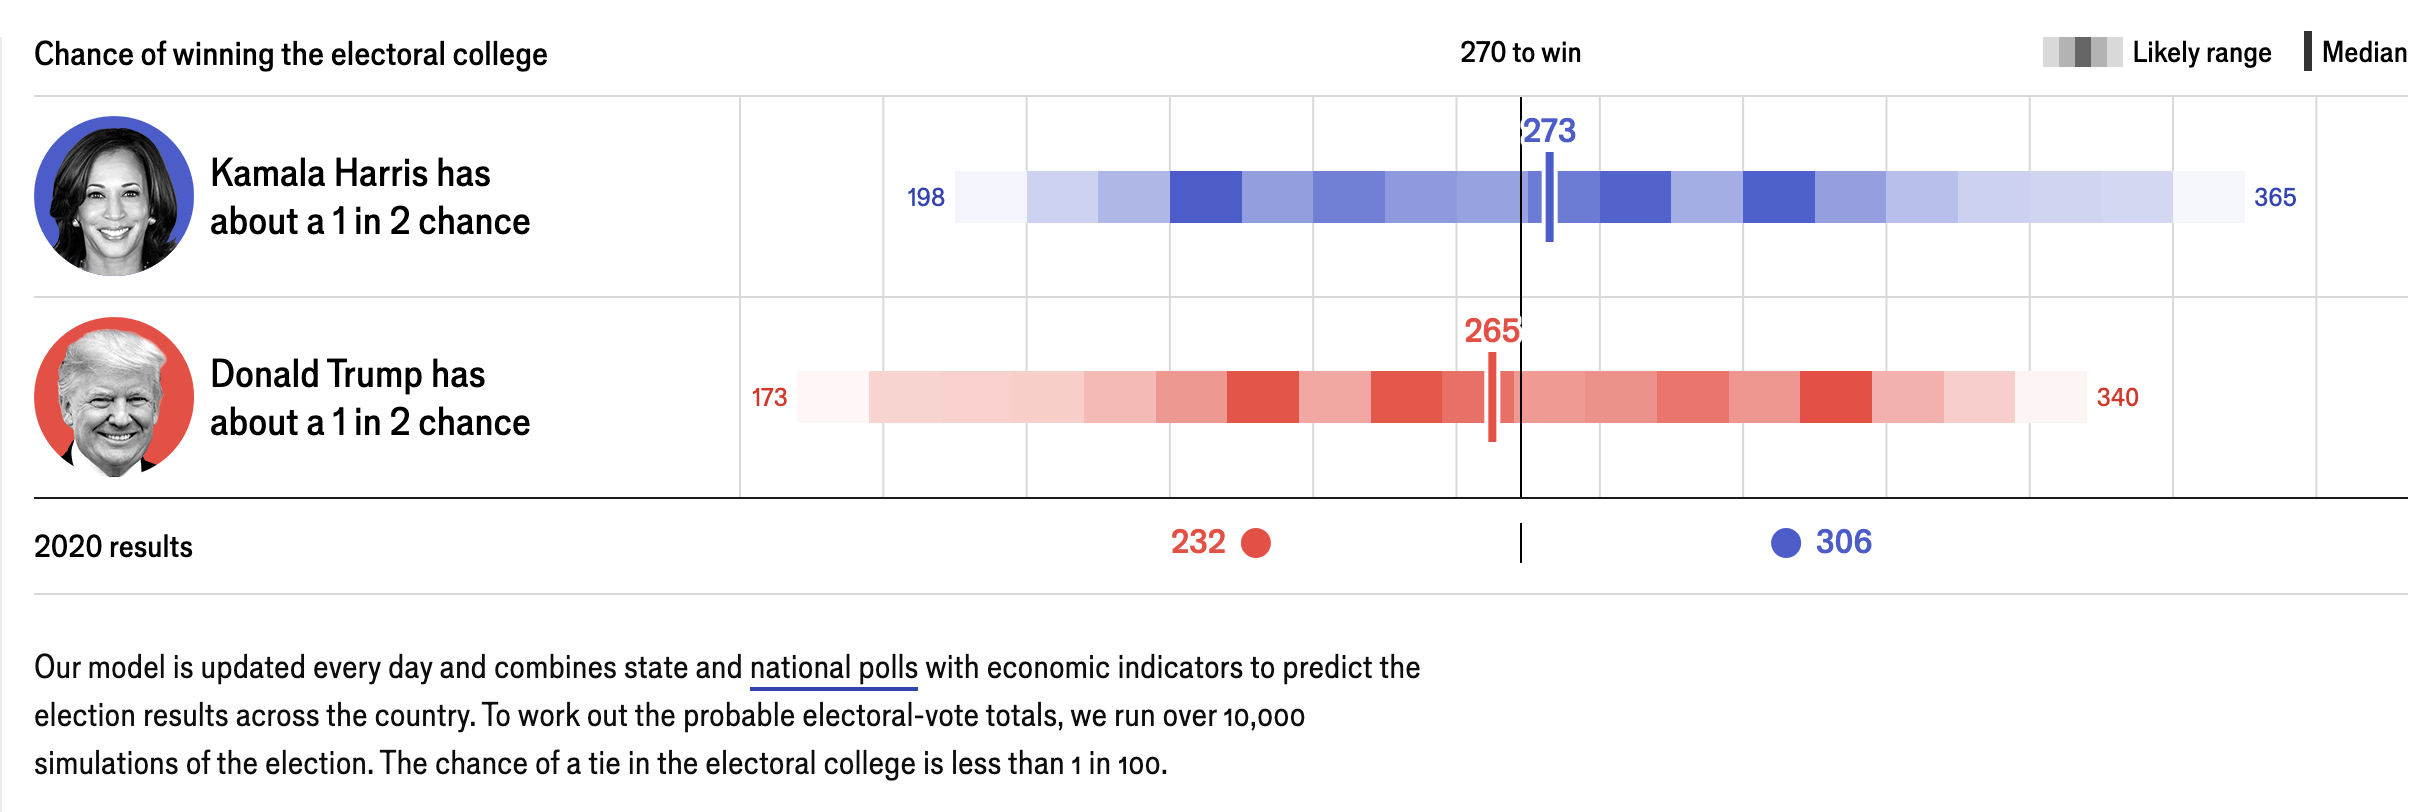
Error Bars/Lines
Purpose: indicate the uncertainty in a quantifiable measure
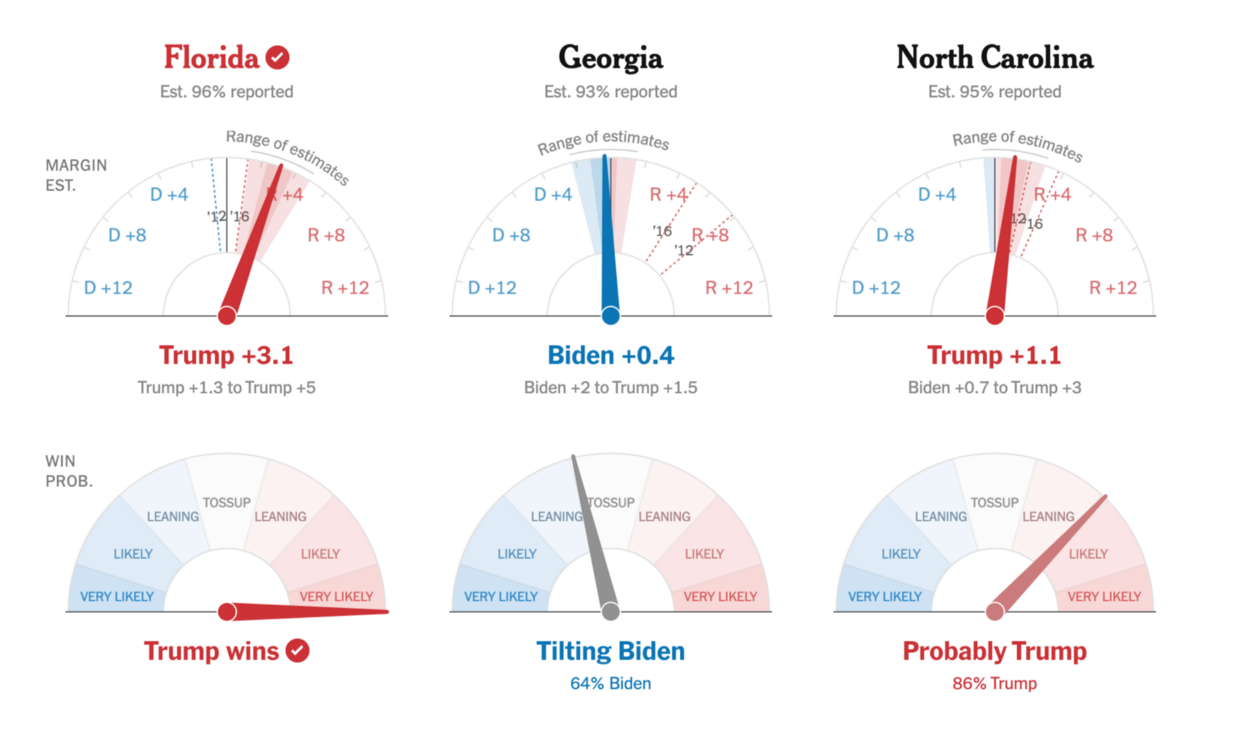
Pros: Useful to compare multiple estimates; easily understood
Cons: Details in the data can get lost if not represented properly.
Distributions
Purpose: Show the spread of possible values
Pros: Judgments made on sample vs. means/median
Cons: Distributions may need additional explanations
Multiple outcomes
Purpose: helpful to see various outcomes for projections/forecasts
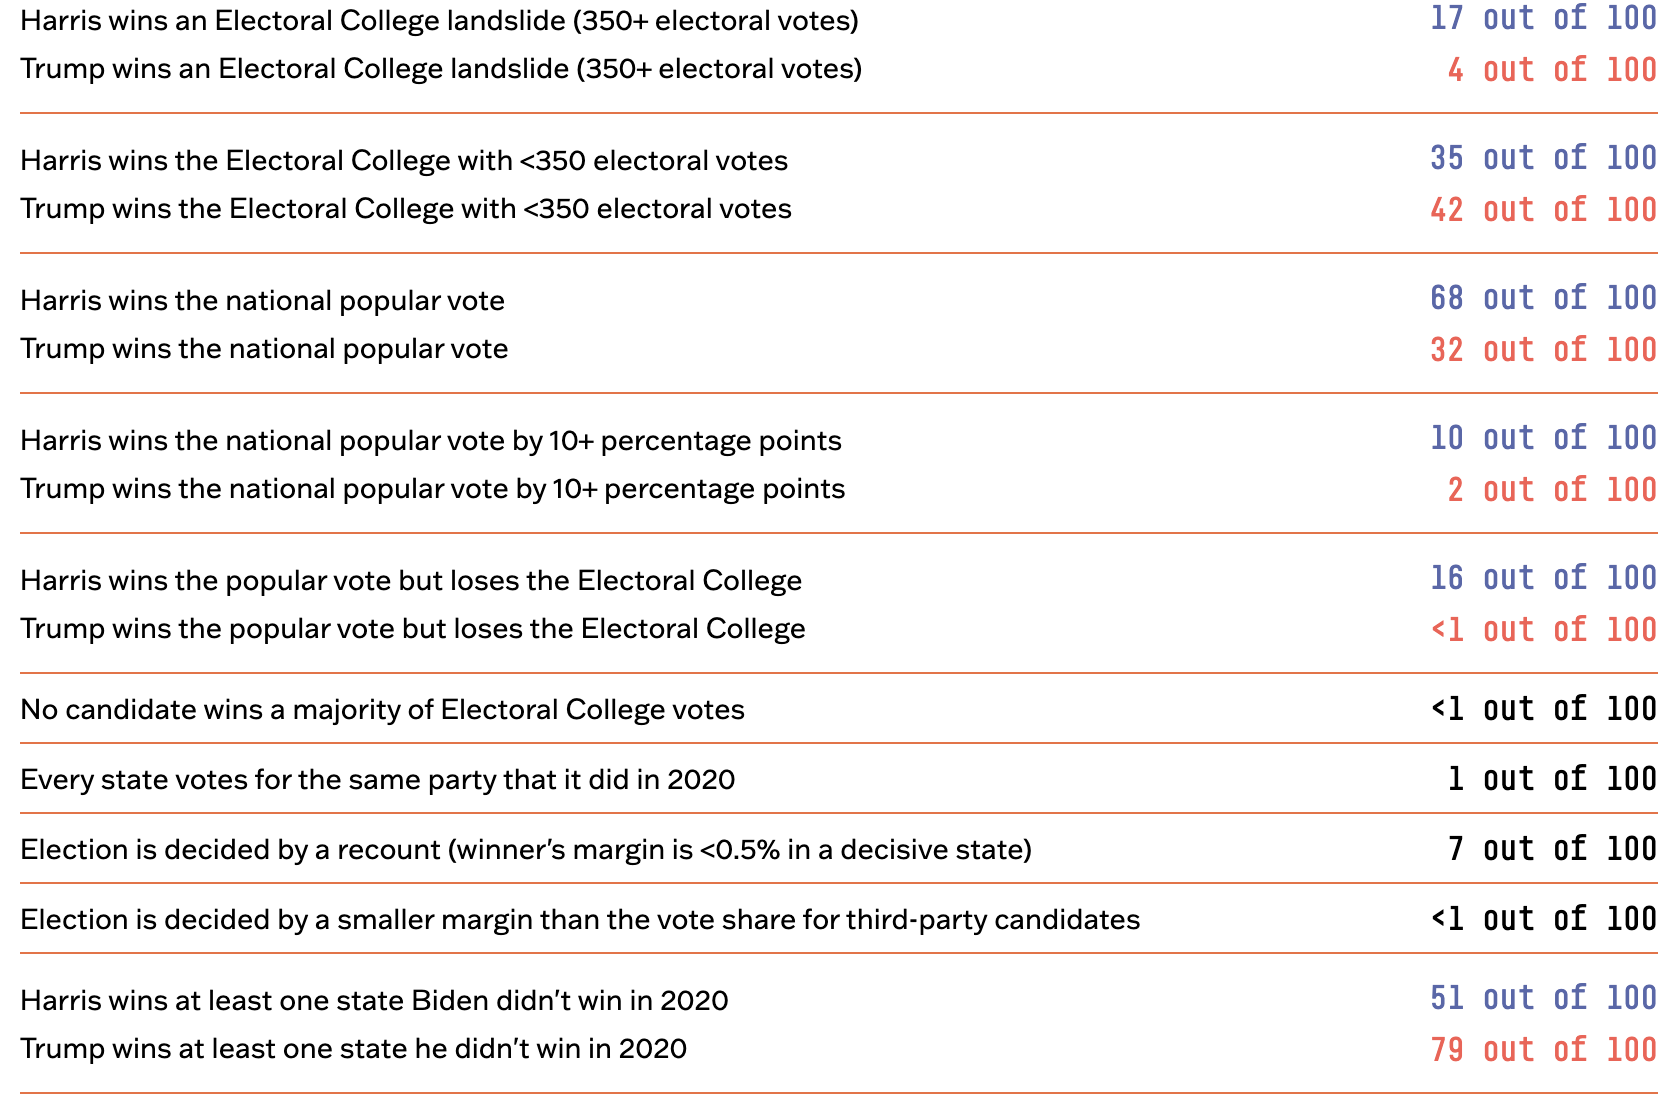
Pros: Uncertainty is displayed more explicitly
Cons: Too many possibilities can lead to confusion